Stress Analysis of a Two Spar Wing
/This was my dissertation project at Brunel University. Idea was to create an FEA (Finite Element Analysis) model of an aircraft wing that can predict stresses under different loads with minimal error. This model to be utilised by students who are learning strain gauge calculations to validate their answers.
I used a physical wing section mounted on a test apparatus to collect strain gauge data and compared the results against the FEA results
Physical wing section came from ‘Van’s Aircrafts’. Part of the tail section of the aircraft model ‘RV-9.

Van’s Aircrafts RV-9
Technical drawings for the wing was also provided by ‘Van’s Aircrafts’ which I used to create a CAD model using Solidworks.

CAD Model Created Using Solidworks

CAD Model Created Using Solidworks - Skin Hidden
Test apparatus was provided by ‘Turbine Technologies’
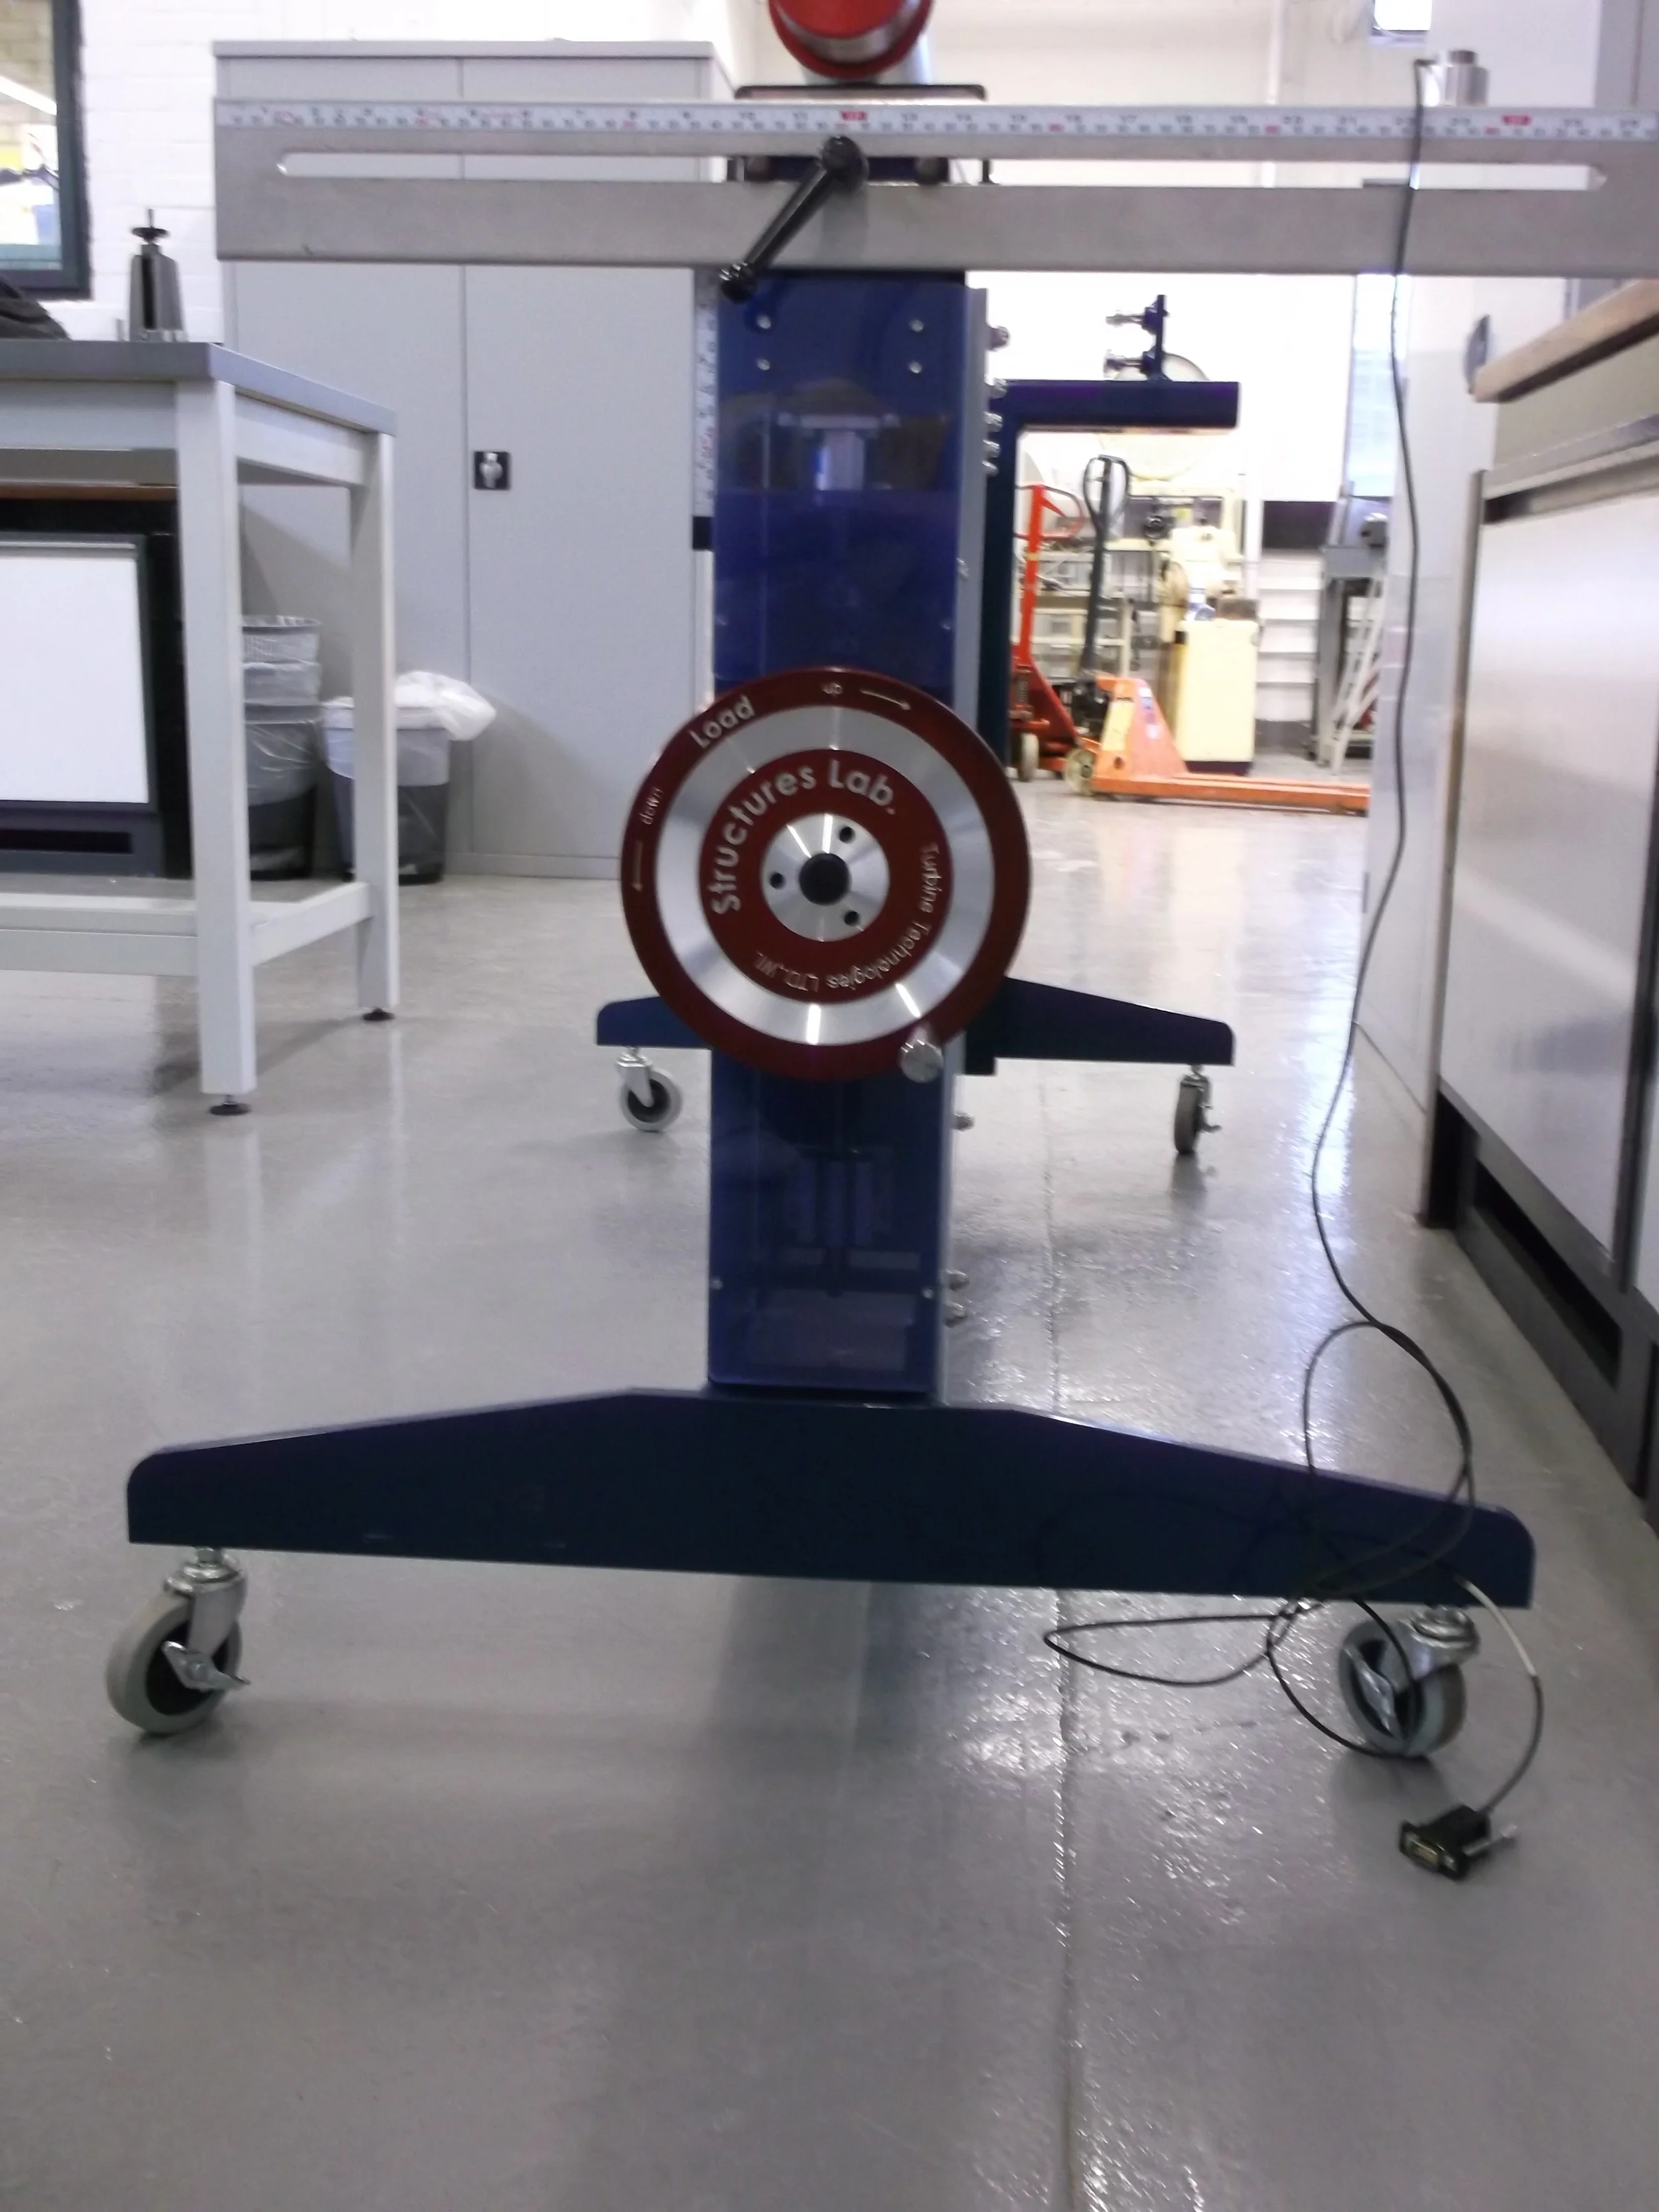
TrueStructures by Turbine Technologies
"Solatron 3535D Scorpio" data logger was used to activate/energise the strain gauges and collect data. The device interprets the resistance change from the strain gauges and sends an output to a computer where 'Scorpio' software was used to register and display the results
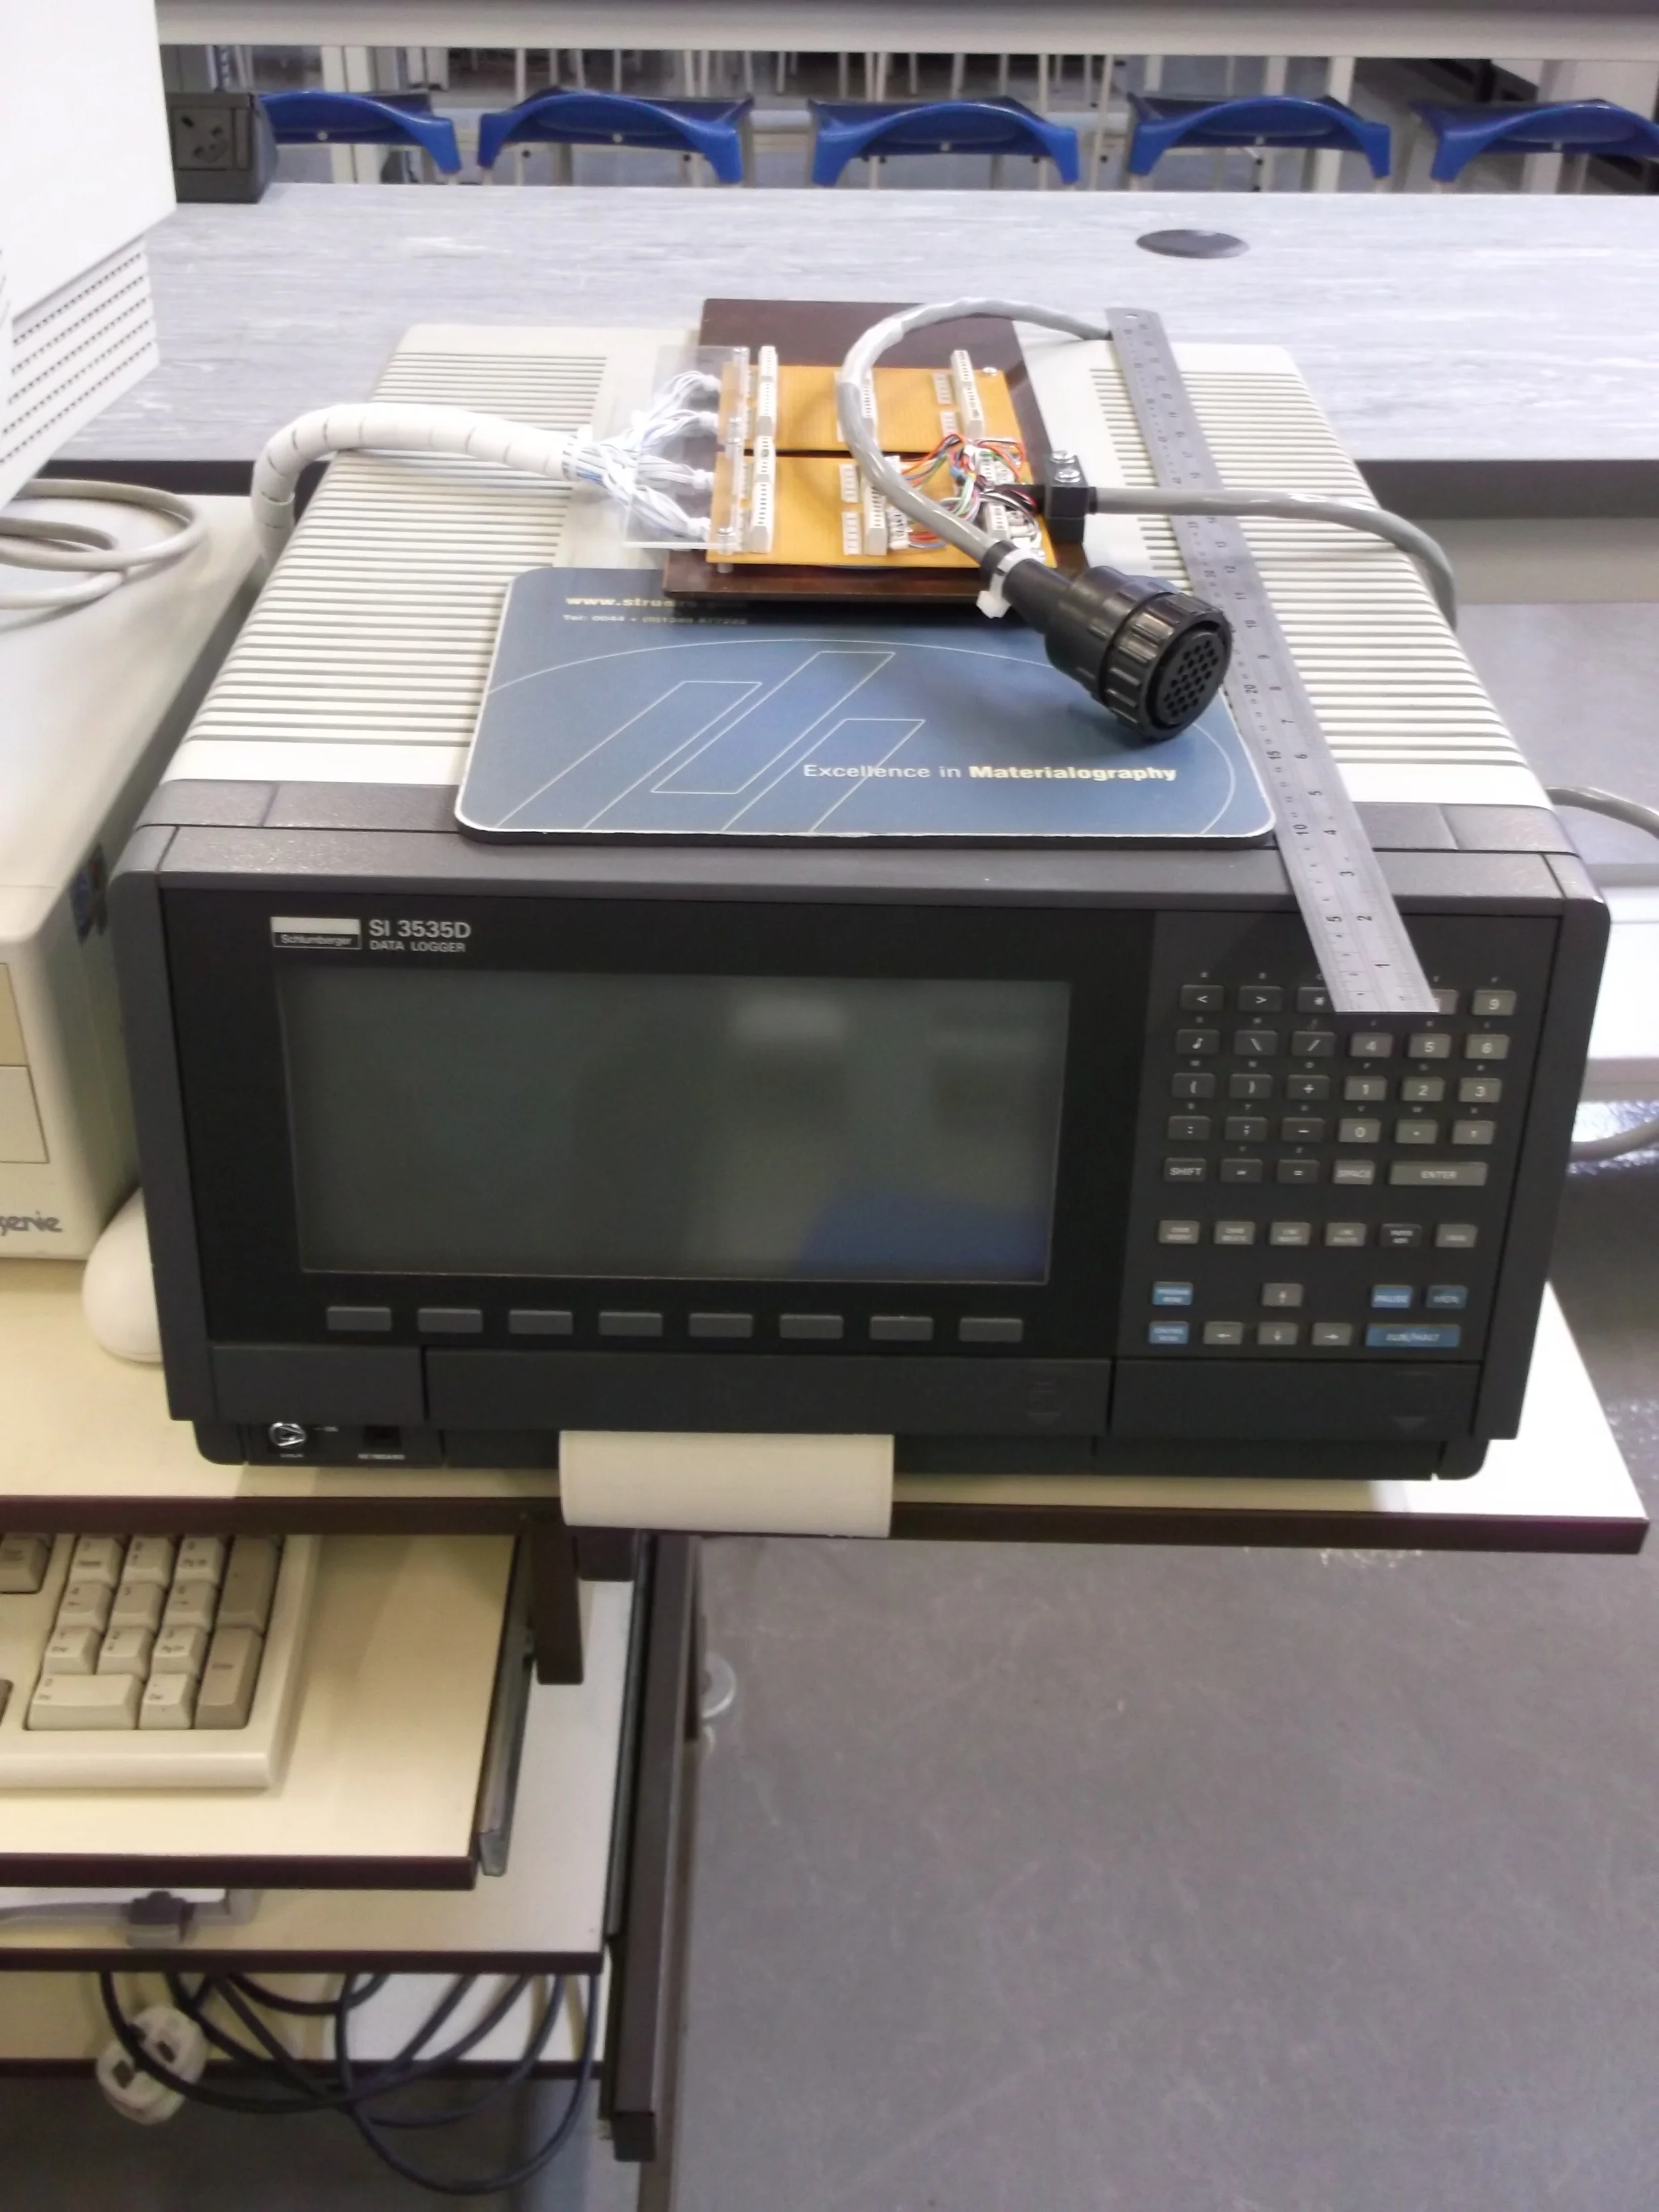
'Solatron 3535D Scorpio' Data Logger
I used ‘Ansys Workbench’ to carry out the simulations (software graciously provided by ANSYS). It was a bit of a learning curve given this was my first time carrying out an FEA simulation of this magnitude.
I simulated a simple I-Beam and a hollow cylinder to get my feet wet; compared them to the results I got from the strain gauges and hand calculations. The difference was about 3%. This was true for pure bending, pure torsion and complex combination scenarios.
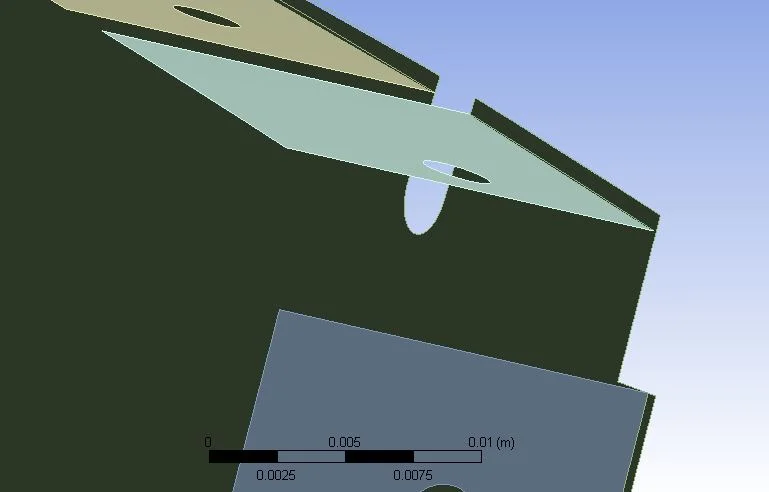
Then I moved on to meshing and simulating the wing section. In meshing, I used a combination of brick elements, shell elements and 3D elements to achieve the best balance of accuracy and computation cost. I also significantly simplified my CAD model in order to save computation cost

Original Model

Unnecessary Details Removed
Further Simplified
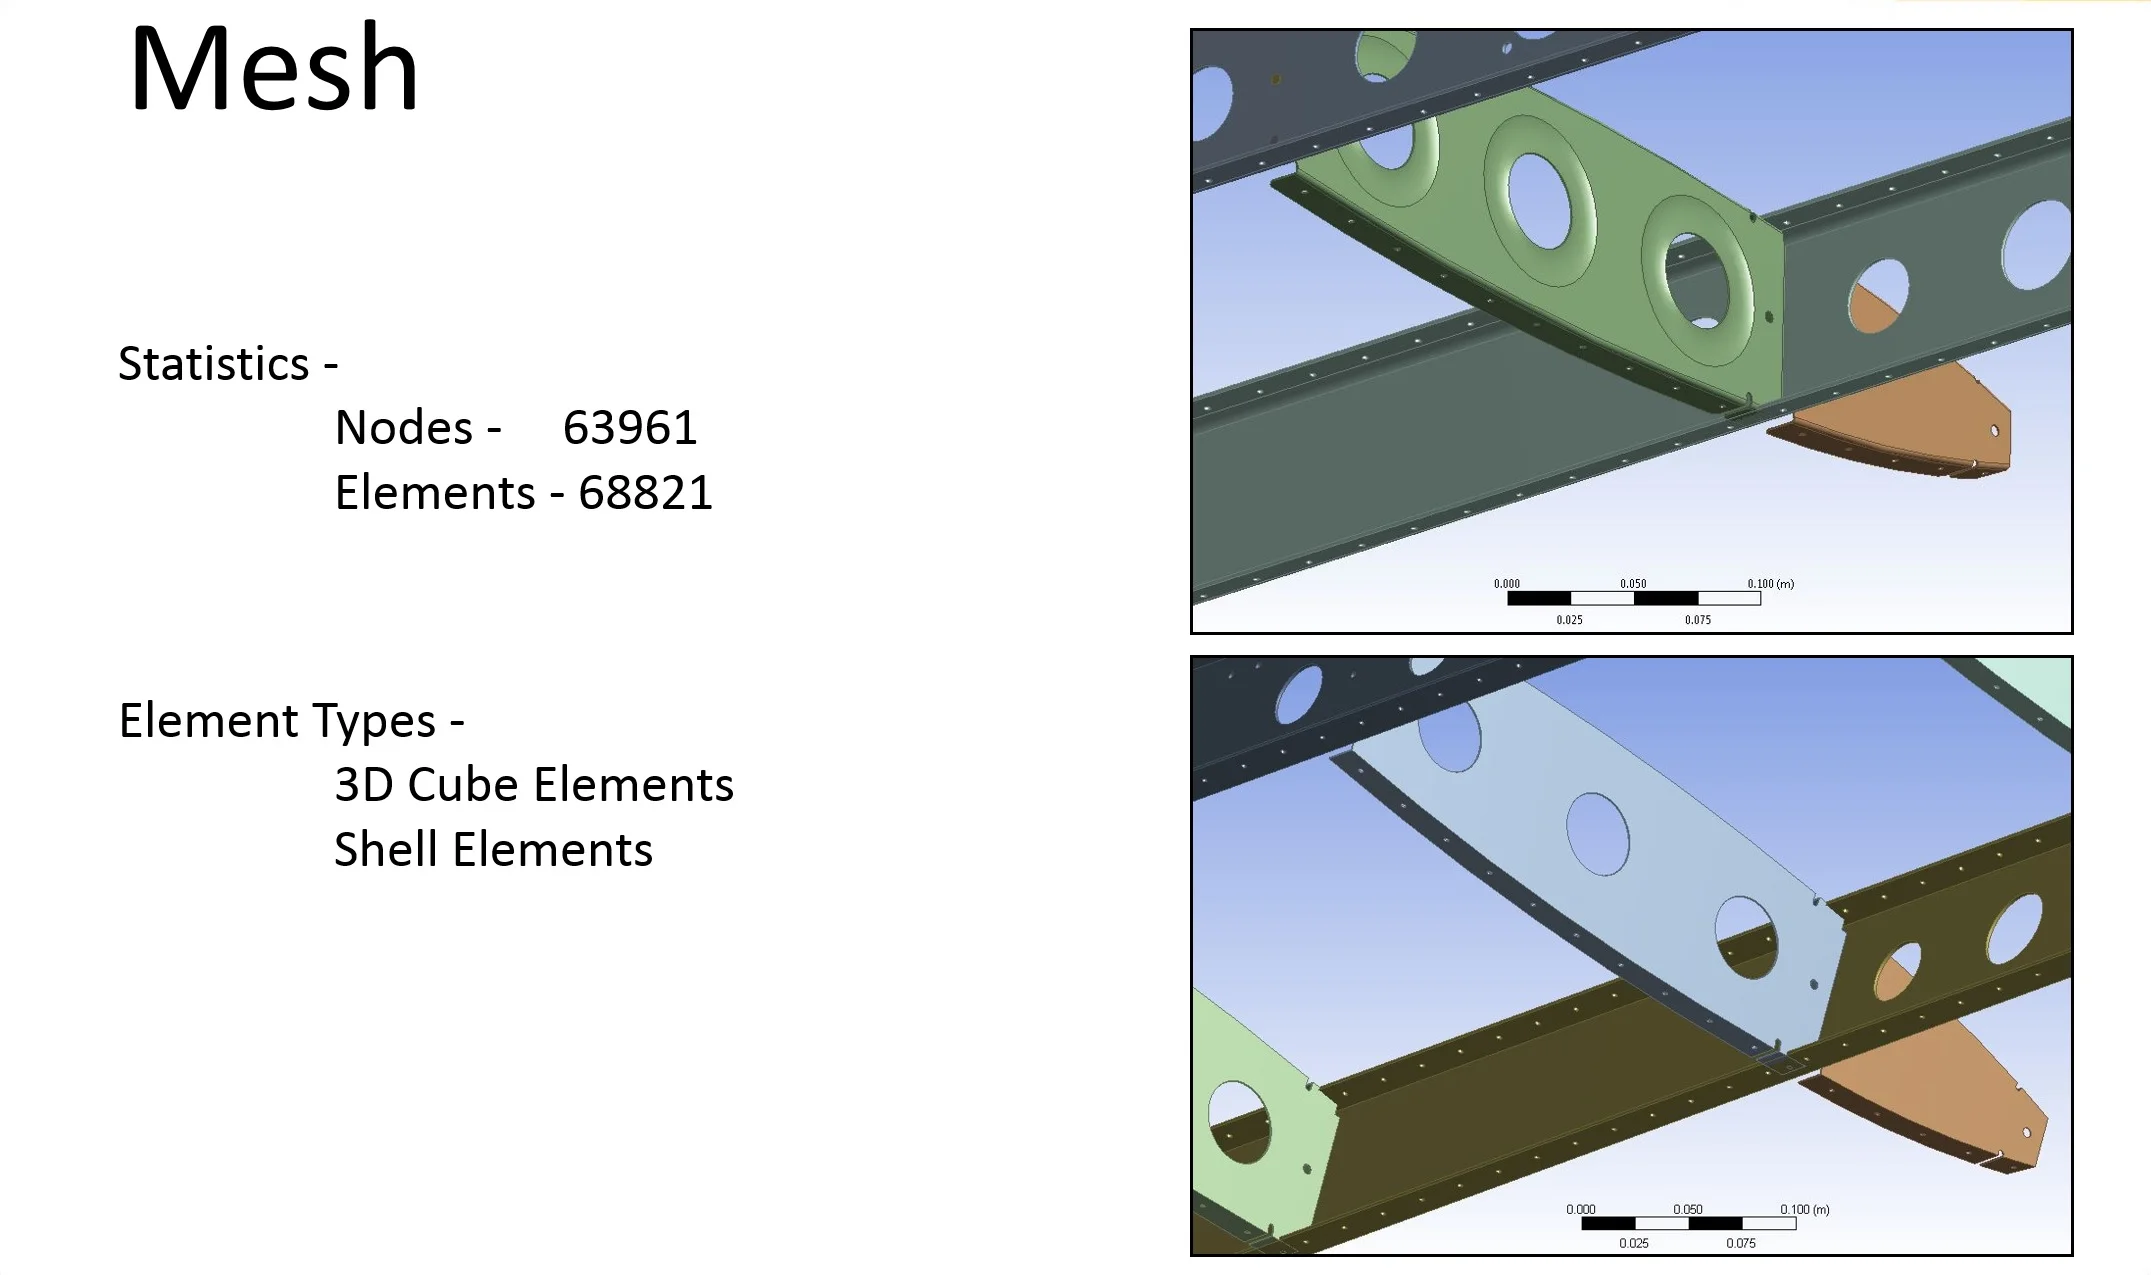
Mesh Statistics
Below are some graphs showing hand calculated results Vs simulated results.
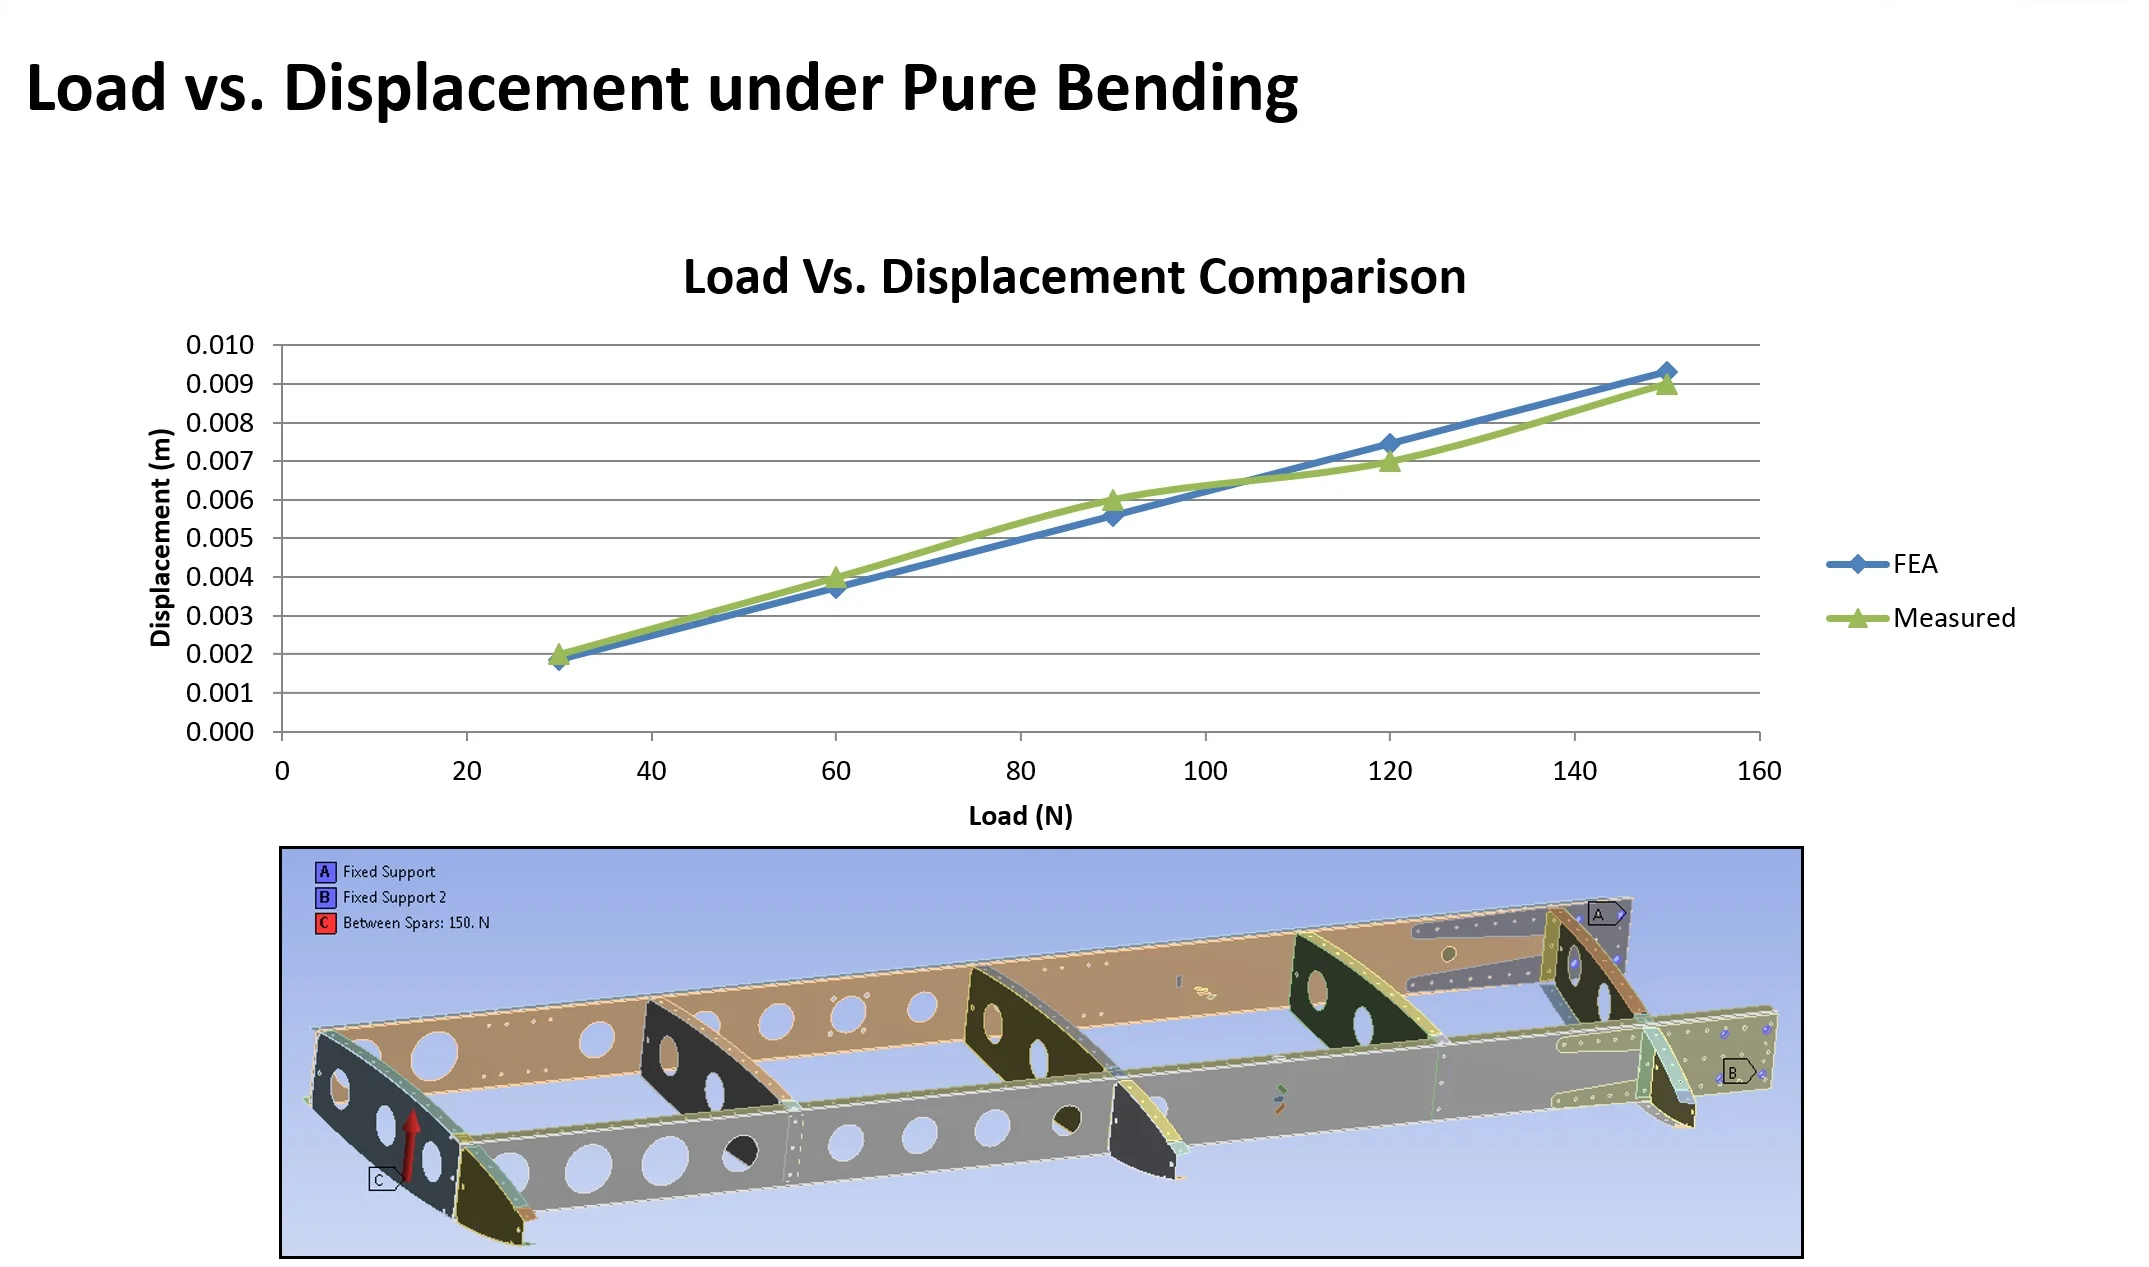
Load Vs. Displacement Comparison - the maximum error was ~8% with an average ~6%

Load Vs. Normal Elastic Strain (SG - Strain Gauge, FEA - Finite Element Analysis) - the maximum error was ~5% with an average ~4%